Countries’ economic vulnerabilities (update)
22 October 2013
Ousmène Jacques Mandeng, Global Institutional Relations Group, Prudential Investment Management
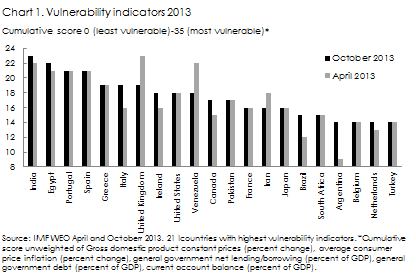
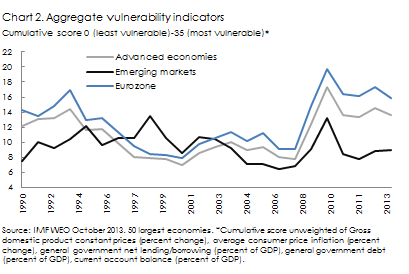
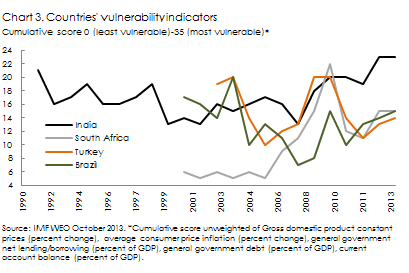
The recent IMF World Economic Outlook (WEO) seems to affirm the notion that the international economy has become more fragile. The vulnerability indicator on the basis of the revised October 2013 data compared with the April 2013 data shows that the composition of the 20 most vulnerable countries remains broadly unchanged while economic fundamentals on average have slightly deteriorated with some exceptions.1 India has replaced the UK as the most vulnerable country and Argentina is now among the 20 most vulnerable countries while Poland dropped out (Chart 1). Italy, Ireland, Canada and Brazil show some notable increases in vulnerability. Advanced economies remain on average significantly more vulnerable than emerging markets but recently some convergence between advanced economies and emerging markets appears detectable. Eurozone vulnerability has declined but remains elevated representing the most vulnerable grouping (Chart 2). Emerging markets suffering recent exchange rate pressures exhibit somewhat though not uniformly higher vulnerability readings (Chart 3).
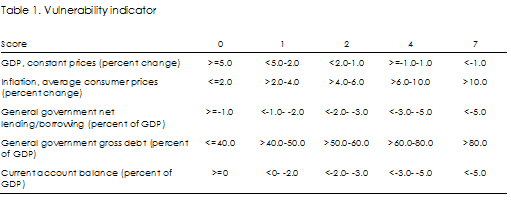
The vulnerability indicator uses IMF data for the largest 50 economies representing 94 percent of 2013 world GDP at market prices.2 The vulnerability indicator is the sum of the score attained for a key set of economic variables (Table 1). The lowest score is 0 (least vulnerable) and the highest 35 (most vulnerable). Scoring is linear for a broad range of levels but poor and very poor economic variables attract disproportionately high scores. GDP is used for economic activity assuming very low growth and recessions have broader negative effects on other variables (revenue and debt). Inflation is used as a proxy for broad internal and external balance where high inflation is seen as potentially destabilizing. Government net lending/borrowing reflects the fiscal policy stance where high deficits are seen as a sign of distress. Gross government debt is used as a proxy for fiscal policy room where high indebtedness may undermine debt sustainability and limit conduct of fiscal policies. The current account balance is used as a proxy for external vulnerability where high deficits may incur payments distress. The vulnerability indicator excludes international reserves, private sector and financial sector variables which is seen as a significant drawback. Other important variables to serve as proxies for social and/or political instability and institutional strength are also omitted which is similarly considered to be a major limitation. The vulnerability indicator uses contemporaneous data and may therefore not be a good crisis predictor. The scoring is subjective and no attempt has been made to test the scoring against econometric vulnerability or early-warning studies.
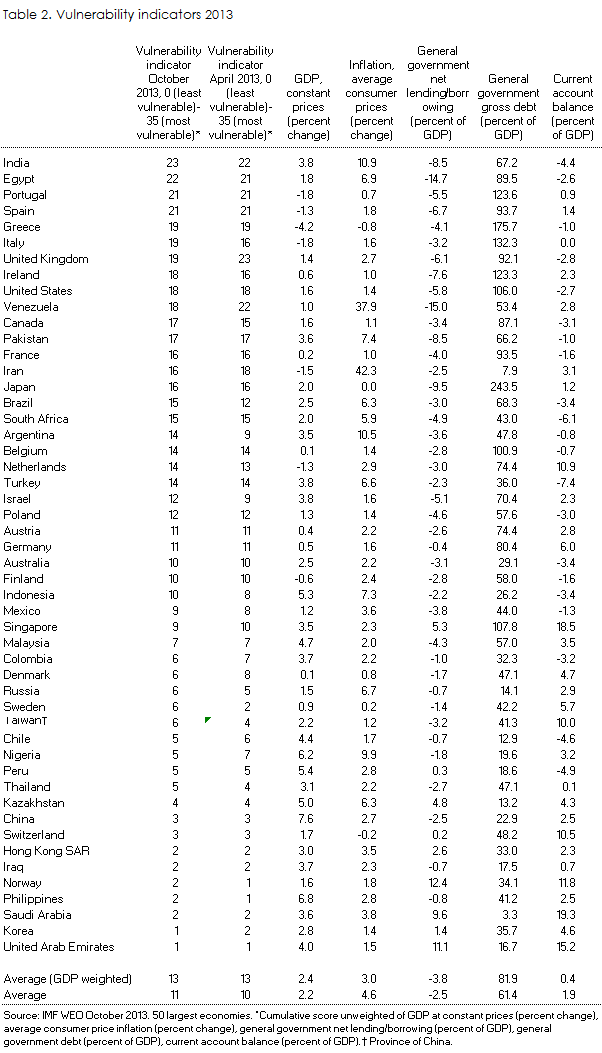
The relationship between poor macroeconomic variables and economic crises is of course nonlinear. Countries differ significantly in their capacity to sustain and address macroeconomic weaknesses and a high score must therefore not be an indication of imminent distress. However, the vulnerability indicator seems to capture well broader based observations that countries’ vulnerabilities have remained elevated compared with pre-crisis levels and are on the rise for some (Table 2).
1 The vulnerability indicator was first presented in Countries’ economic vulnerabilities of 6 September 2013.
2 Data are based on IMF World Economic Outlook (WEO) database October 2013. Reporting countries’ population differs over time amid defficient data reporting: 11 countries out of the 50 largest of 2013 offer full data availability for indicator construction in 1980, 20 in 1990 and 45 in 2000.