International portfolio investment holdings update
26 April 2017
International portfolio investments continue to show signs of globalisation fatigue. The latest IMF Coordinated International Portfolio Survey (CPIS) of non-official cross-border portfolio investment holdings with data through June 2016 reveal that total international portfolio investments have continued to decline in percent of world GDP. Investments in the Euro Area have suffered the most. Emerging markets have been zigzagging and remain below their peak.1
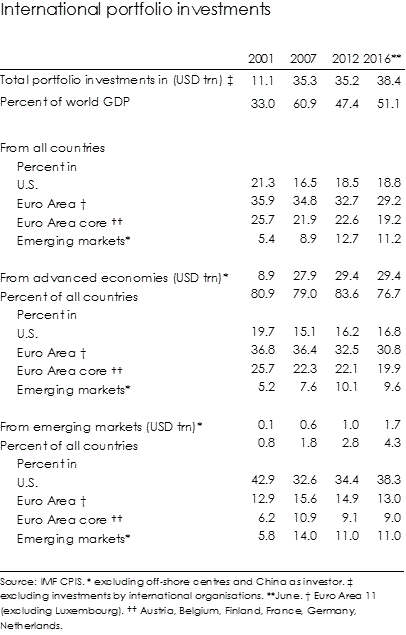
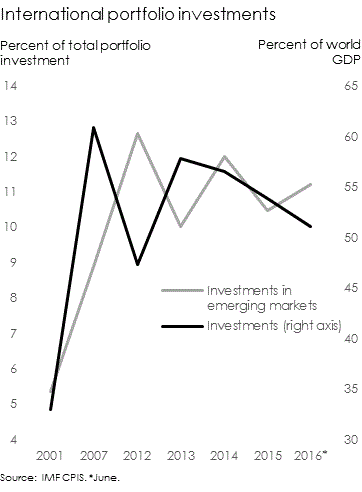
International portfolio investment holdings have seen an extraordinary expansion prior to the global financial and economic crisis. Total portfolio investments increased from 33 percent of world GDP in 2001 to 61 percent in 2007 (Table). Investments fell to 47 percent of world GDP in 2012 and have recovered since though remain significantly below their 2013 local high (Figure). In nominal terms, international portfolio investments remain close to their high at US$75 trillion in 2016.
The distribution of international portfolio investments has changed to an important extent since the beginning of the crisis. Investments in the U.S. expanded between 2007 and 2016, though remain below their 2014 high. The Euro Area has seen continued losses in allocations in particular since 2007. Investments in the Euro Area core (Austria, Belgium, Finland, France, Germany, Netherlands) have registered a significantly smaller decline than investments in the Euro Area overall. The Euro Area has retained the highest share in portfolio investment holdings.
Investments in emerging markets have maintained advances in international portfolio allocations. However, after expanding through 2012, the share of emerging markets dropped in 2013 and 2015 but recovered in 2016. The decline in overall international portfolio investment holdings may have contributed to slowing investments in emerging markets and sustained less favourable overall international investment trends may challenge a further push. Overall, the share of investments in emerging markets at 11 percent has remained significantly below the share of emerging markets in world GDP of 43 percent.
The allocation pattern between advanced economies and emerging markets continue to differ. Emerging markets maintained a significantly higher allocation to the U.S. of 38 percent, rebounding since the beginning of the crisis, compared with advanced economies at 17 percent. The Euro Area continues to invest heavily in the Euro Area though has recorded a continuous decline.
The pattern of portfolio investment holdings differs greatly among advanced economies. The U.S. has remained the largest investor in emerging markets with 16 percent of total portfolio investments in 2016 in emerging markets followed closely by the U.K. France and Germany only hold 4 and 5 percent, respectively, of their portfolio investments in emerging markets with the Euro Area (11) also holding only 5 percent.
Emerging markets remain only a very small proportion of international portfolio investors representing 4 percent of total portfolio investors. This compares unfavourably with the share of emerging markets in the world economy. The allocation to emerging markets by emerging markets investors continues to be higher at 11 percent of total allocations than the allocation by advanced economies of less than 10 percent though remains below its 2007 peak. While China remains a giant as an official sector investor, as a private sector investor it only represents 0.8 percent of total international portfolio investment holdings.
International portfolio investments remain a benchmark indicator for globalisation. The 2016 data serves as a reminder that globalisation is receding and that it continues to be a very one-sided affair. Advanced economies remain highly disproportionately both investors and investments. The integration of emerging markets as portfolio investors and investments continues to disappoint.
1 All 2016 reference for June 2016 only. All country group references exclude off-shore centres on the investor and investment side. The Euro Area comprises Austria, Belgium, Finland, France, Germany, Greece, Ireland, Italy, Netherlands, Spain, Portugal.